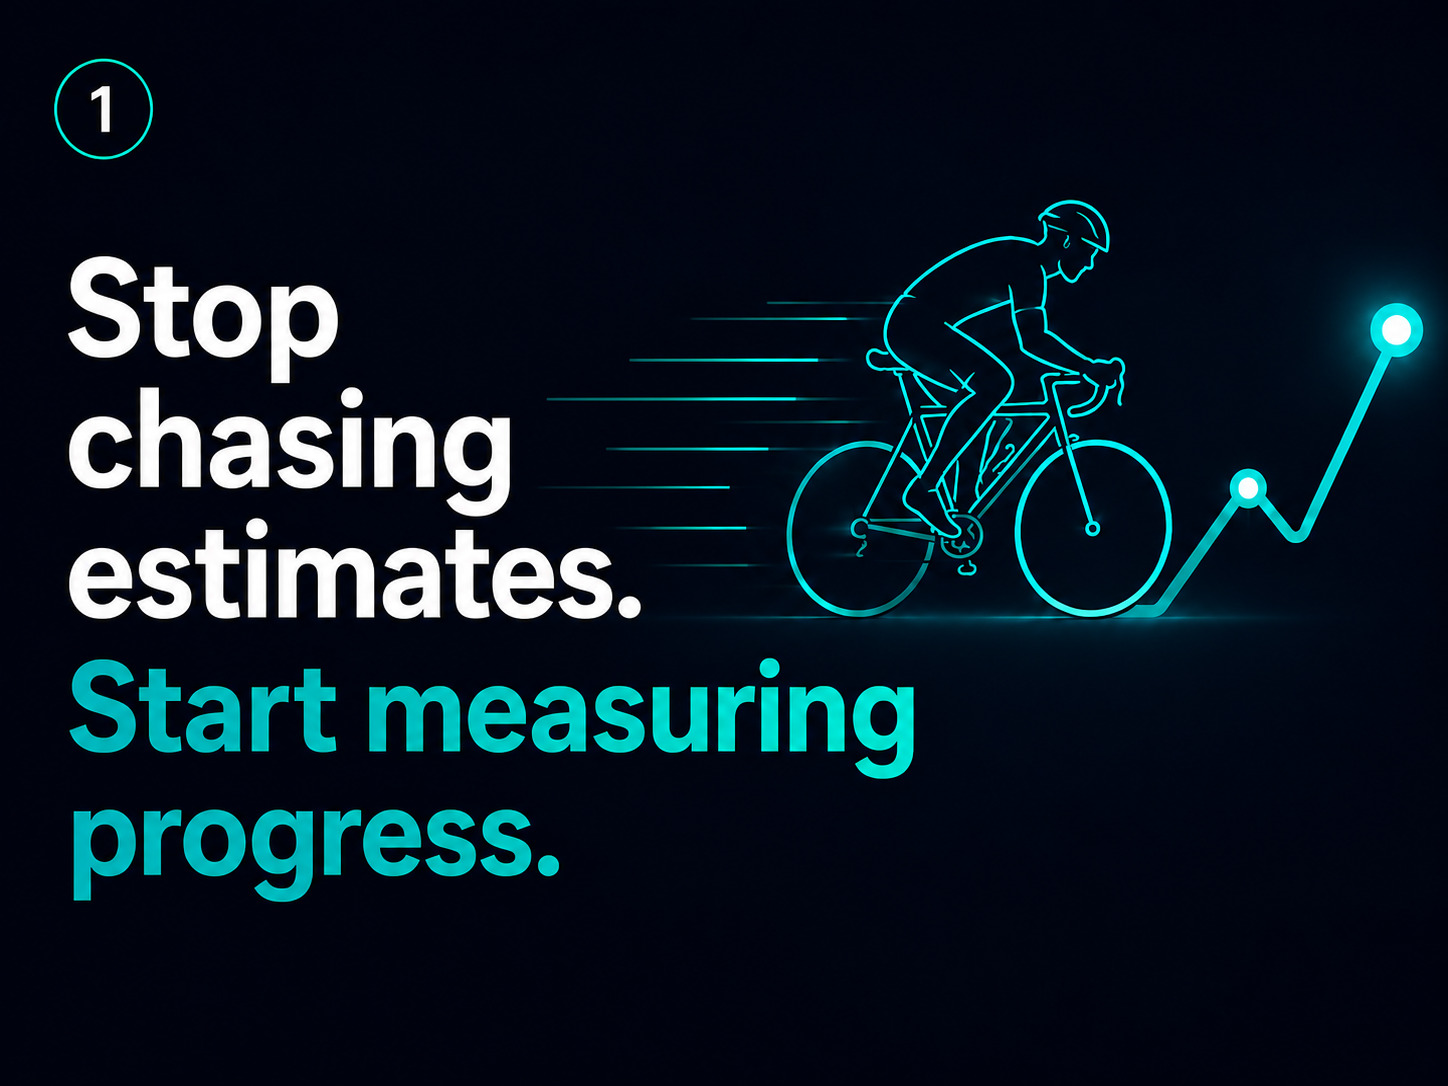
Most of us ride because we enjoy it. But somewhere along the way, a question creeps in: am I actually getting any better?
It is a harder question to answer than it should be. You finish a ride feeling strong, but the numbers look ordinary. You drag yourself round a loop that felt brutal, and the data says it was easy. After a while you stop asking, or you go looking for a number that will settle it.
We have been taught that fitness is one number
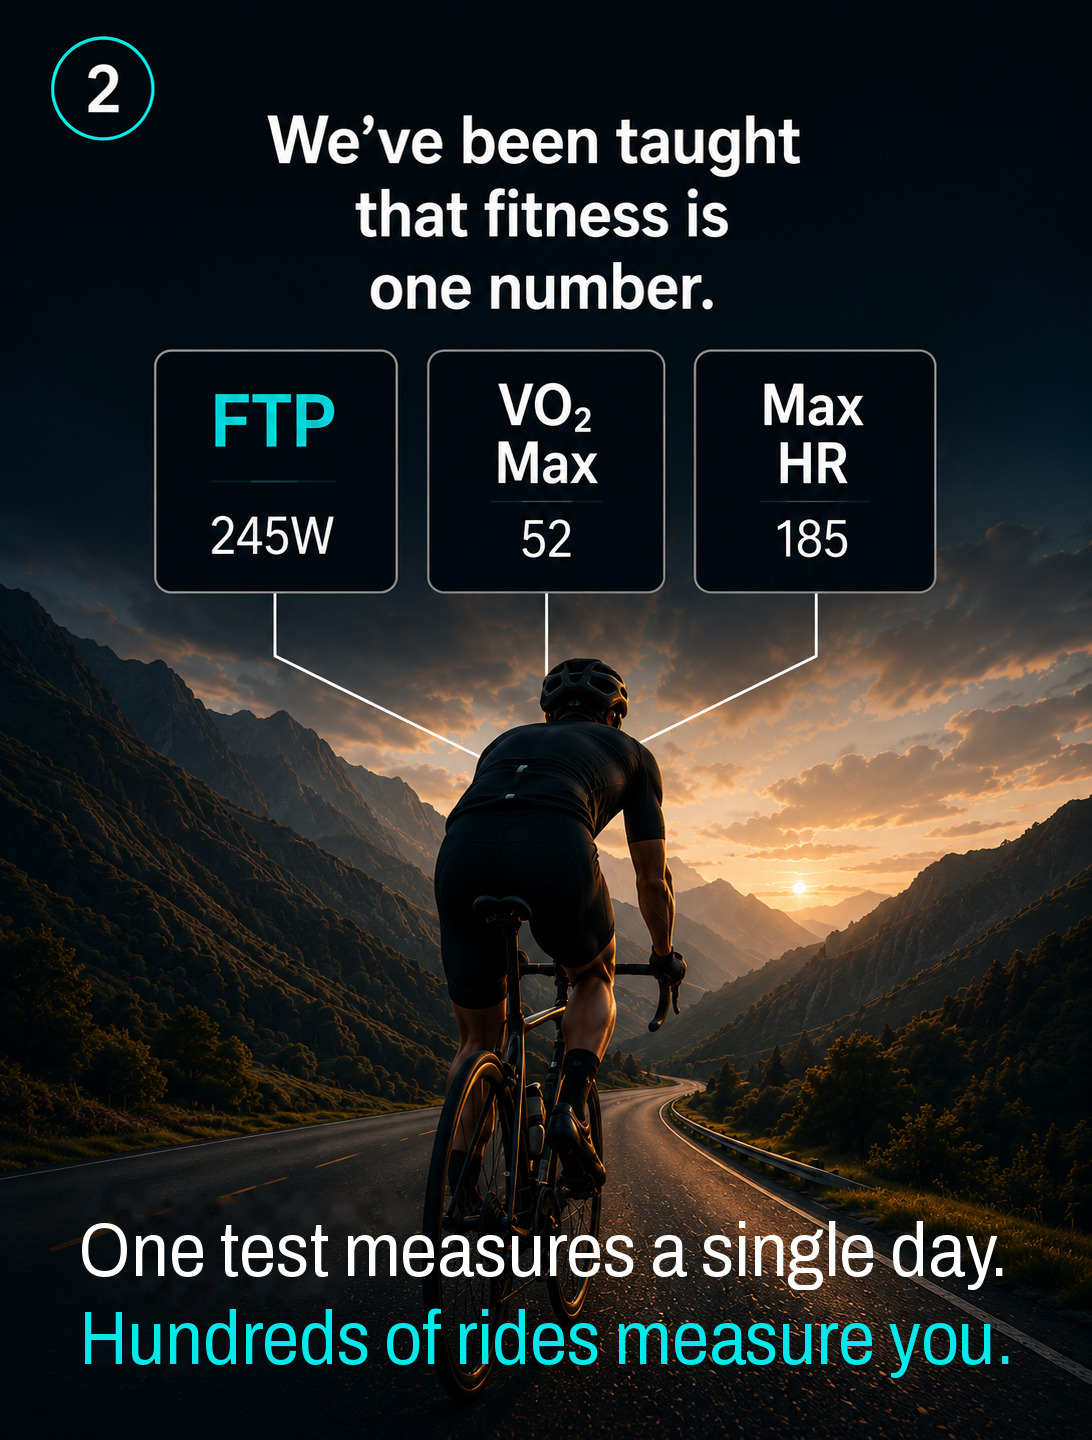
FTP. VO₂ Max. Maximum heart rate. Somewhere in an app you probably have all three, and they carry a lot of authority — they look precise, and everyone talks about them.
If you have not met them properly: FTP is the power you are meant to be able to hold for about an hour. VO₂ Max is how much oxygen your body can use flat out. Maximum heart rate is what it sounds like.
But think about where they come from. Each one is the result of a test, or an estimate, taken on a single day. Maybe you were fresh that day. Maybe you had slept badly, or it was too hot, or you went off too hard in the first five minutes and paid for it.
One test measures a single day. Hundreds of rides measure you.
And most of us do not retest often. That number gets set in spring and quietly follows us around for months, while our actual fitness moves up and down underneath it.
Every ride tells part of the story
Here is the thing a single test can never capture: you do not ride the same way twice.
- Some rides are fast.
- Some rides are hard.
- Some are deliberately slow, because you need the recovery.
None of those is the “real” you. All of them are. And every one of them contributes something to where your fitness actually is — including the easy ones, which is the part most of us forget.
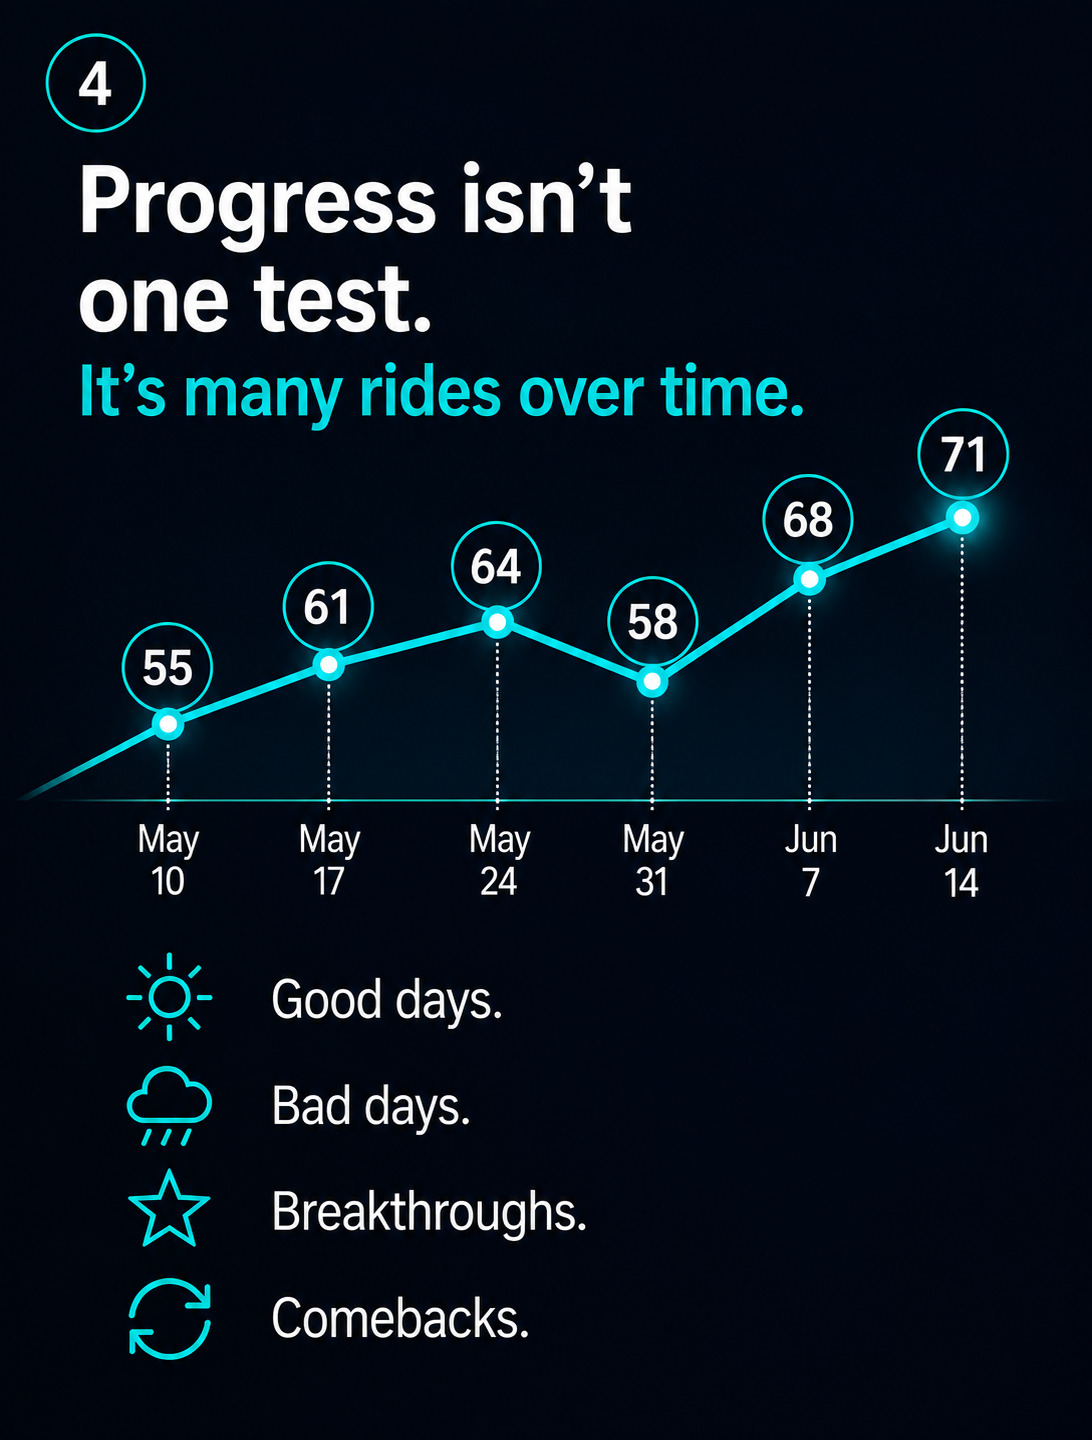
Progress is not one test. It is many rides over time.
If you plot your riding week by week, what you get is not a straight line. You get good days and bad days. You get a fortnight where everything clicks, then a week where you feel like you have gone backwards. You get illness, work, weather, and the comeback afterwards.
That shape — up, down, dip, recovery, new high — is the progress. A single test taken at one point on that line tells you almost nothing about the direction you are heading.
Every ride is different. Your effort tells the truth.
The other problem with judging yourself on raw output is that conditions do so much of the work.
- Weather changes. A headwind can cost you two or three km/h for the same effort.
- Terrain changes. A rolling route and a flat one produce completely different numbers.
- Group rides change everything. Sitting in a bunch is a different sport from riding solo.
Your average speed will happily tell you that you had a great day when really you had a tailwind. What does not lie is how hard you worked to get the result — and how that compares to what is normal for you.
That is the distinction worth holding onto: measure the rider, not the ride.

You already have something better than a test
You do not need an age formula. You do not need a lab. You do not need to go and redo an FTP test you have been avoiding since March.
You already have the best reference point available: your own riding history. Every ride you have uploaded is a data point about you specifically — your fitness, your terrain, your conditions, your normal.
Compared against that, today’s ride actually means something. It updates itself every time you go out, and it never needs calibrating.

Making sense of it all
This is what RideIQ was built to do. Every ride gets a single score, built from two simple things:
- Intensity — how hard you rode.
- Volume — how much you rode.
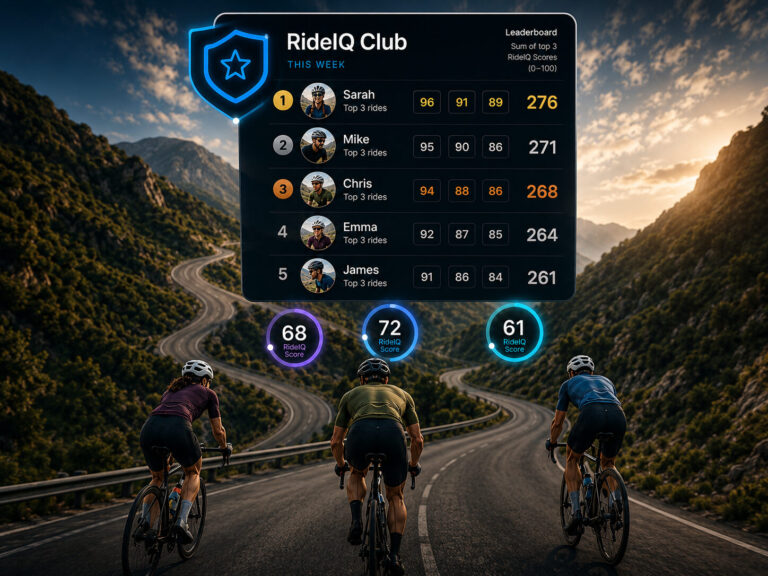
Together they become your RideIQ Score — one number that reflects the ride you just did, measured against the riding you have actually been doing. No zones to set up. No threshold test. No calibration.
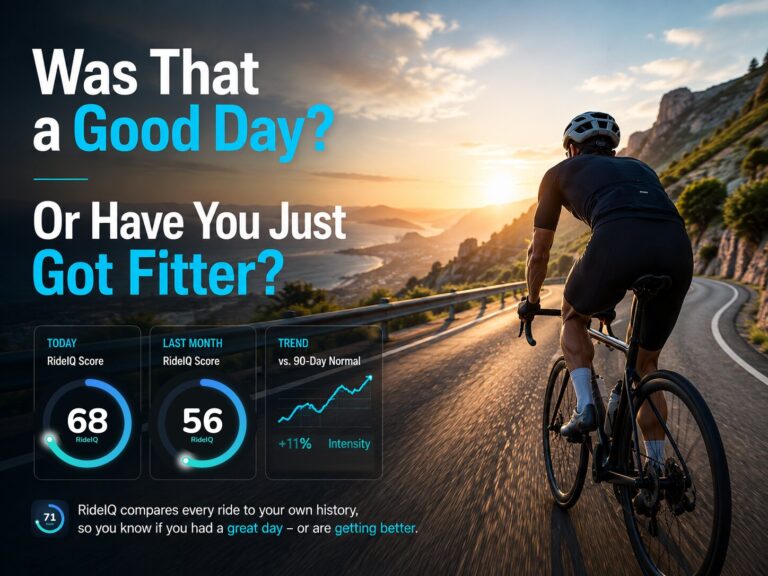
The scale is anchored to you rather than to a pass mark. A ride right at your normal lands on 50 — not a mediocre result, simply your own average day. Above it you rode more than usual; below it, an easier or shorter one.
Watch it week to week and you see the real shape of your riding: the good days, the flat spells, the breakthroughs, and the comebacks. You can also hold a single ride up against that baseline directly, and choose whether “your normal” means then or now — was that a good day, or have you just got fitter?
One thing this does not replace
To be clear about where this fits: if you are following a structured plan built around zones — intervals prescribed at specific percentages of threshold — this does not replace that. Zones exist to tell you what to do. A history-based score tells you how it actually went.
Plenty of riders use both. But if you are not following a formal plan — and most of us are not — you do not need to build one just to find out whether you are improving. We made that argument in full in Ride your ride. RideIQ writes it up.
Turn effort into meaningful progress
You do not need to become a different kind of cyclist to know whether you are getting fitter. You do not need a coach, a lab, or a testing protocol you dread.
You need a way of looking at the riding you are already doing that tells you the truth about it.
Stop chasing estimates. Start measuring progress — against the only benchmark that has ever really mattered. You.
Start measuring your progress against the only benchmark that has ever mattered.
Free for 30 days, no obligation. Subscribe whenever you like — the rides you have already brought in stay yours either way.
New to RideIQ? See everything the app does →