Turn effort into meaningful progress.
Every ride measured against your own history — never population averages or FTP tables. Connect Strava and see what’s actually making you faster.
Free for 30 days. No obligation.
★★★★★
“Finally an app I can’t wait to open after every ride.”
— First Time User
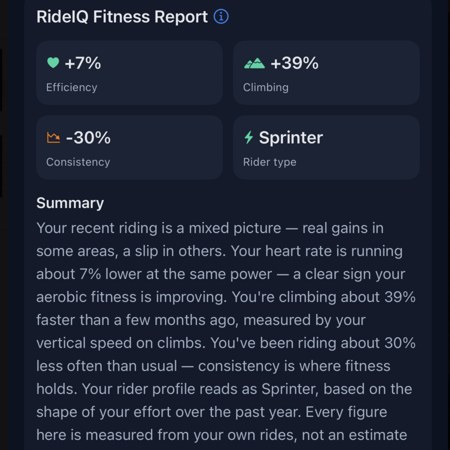
Fitness Report
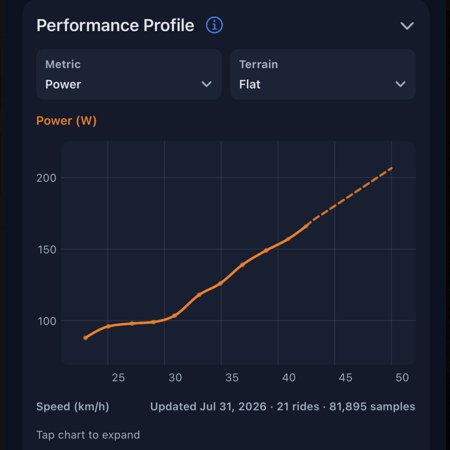
Efficiency Insights
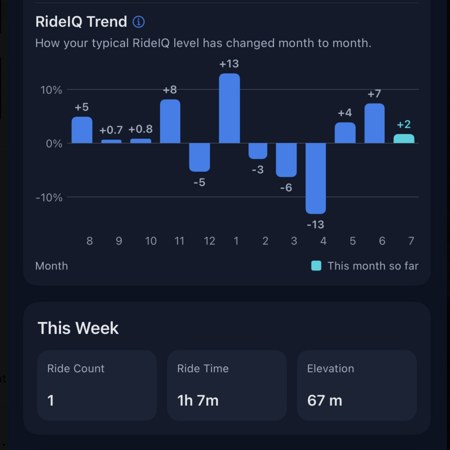
Progress Tracking
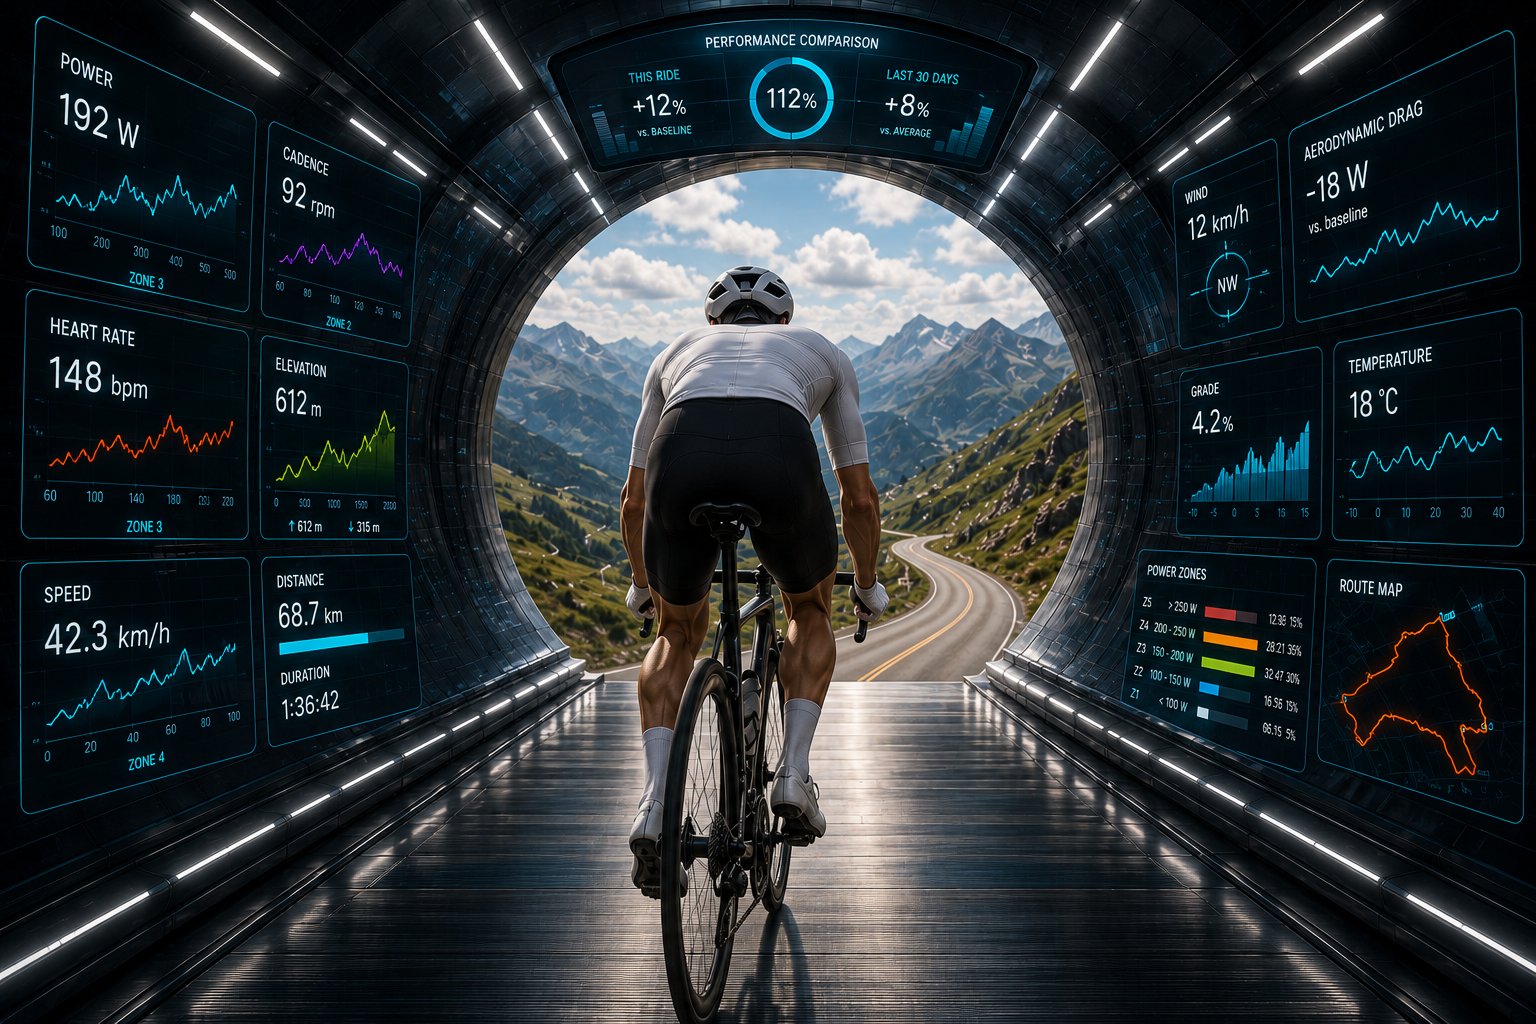
No lab visit required
RideIQ learns from your ride data to build a baseline and deliver clear, consistent performance insights. No lab visits needed (FTP, max HR, VO₂ Max, lactate threshold).
The only benchmark that matters is you.
Most cycling analytics measure you against fixed numbers — FTP tables, VO₂ Max estimates, population averages. Those tell you where you sit among strangers. They don’t tell you whether you’re improving.
RideIQ compares every ride against your own riding history. Your score, your progress, your equipment — all measured against the rider you were last month.
The goal was never to beat other riders. It’s to beat the rider you were.
Everything RideIQ does with a ride
Every feature, one idea: measure you against you.
RideIQ Score
Every ride gets one number, measured against your own recent riding. No zones, no threshold test, no setup.
Strava Sync
Connect once and RideIQ imports your history — up to two years or 730 rides — then keeps up automatically.
RideIQ Lab
Compare wheels, tires, pressure or position across your own rides, and see what actually saved watts. See how Lab measures it →
Ride Memory
A journal of every ride, so you can recall how it felt weeks or months later — not just what the numbers say.
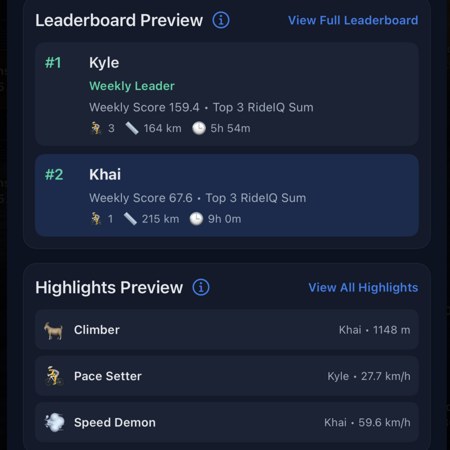
RideIQ Club
A weekly leaderboard ranked on your three best scores — so the most improved rider wins, not the strongest. Why the most improved wins →
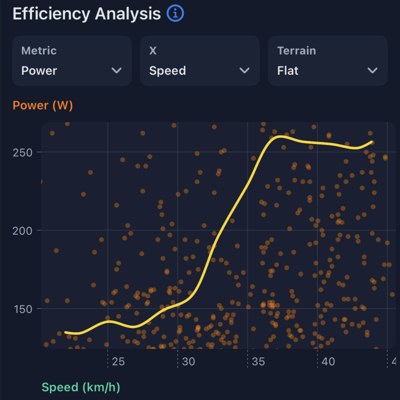
Ride Analysis
Automatic analysis of pacing, climbing, cadence and efficiency, explaining what actually happened on the ride. See how a ride gets read →
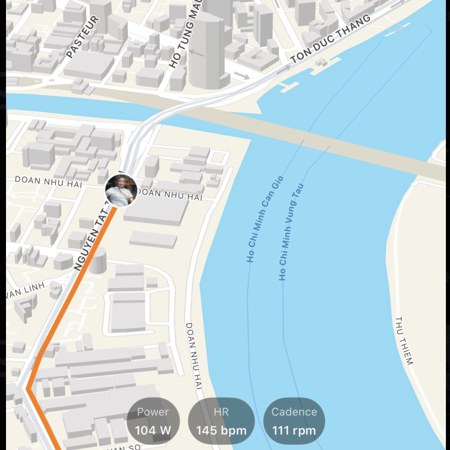
Cinematic Replay
Replay any ride in 3D from over ten camera angles, set to our built-in playlists or your own music. Meet the RideIQ Director →
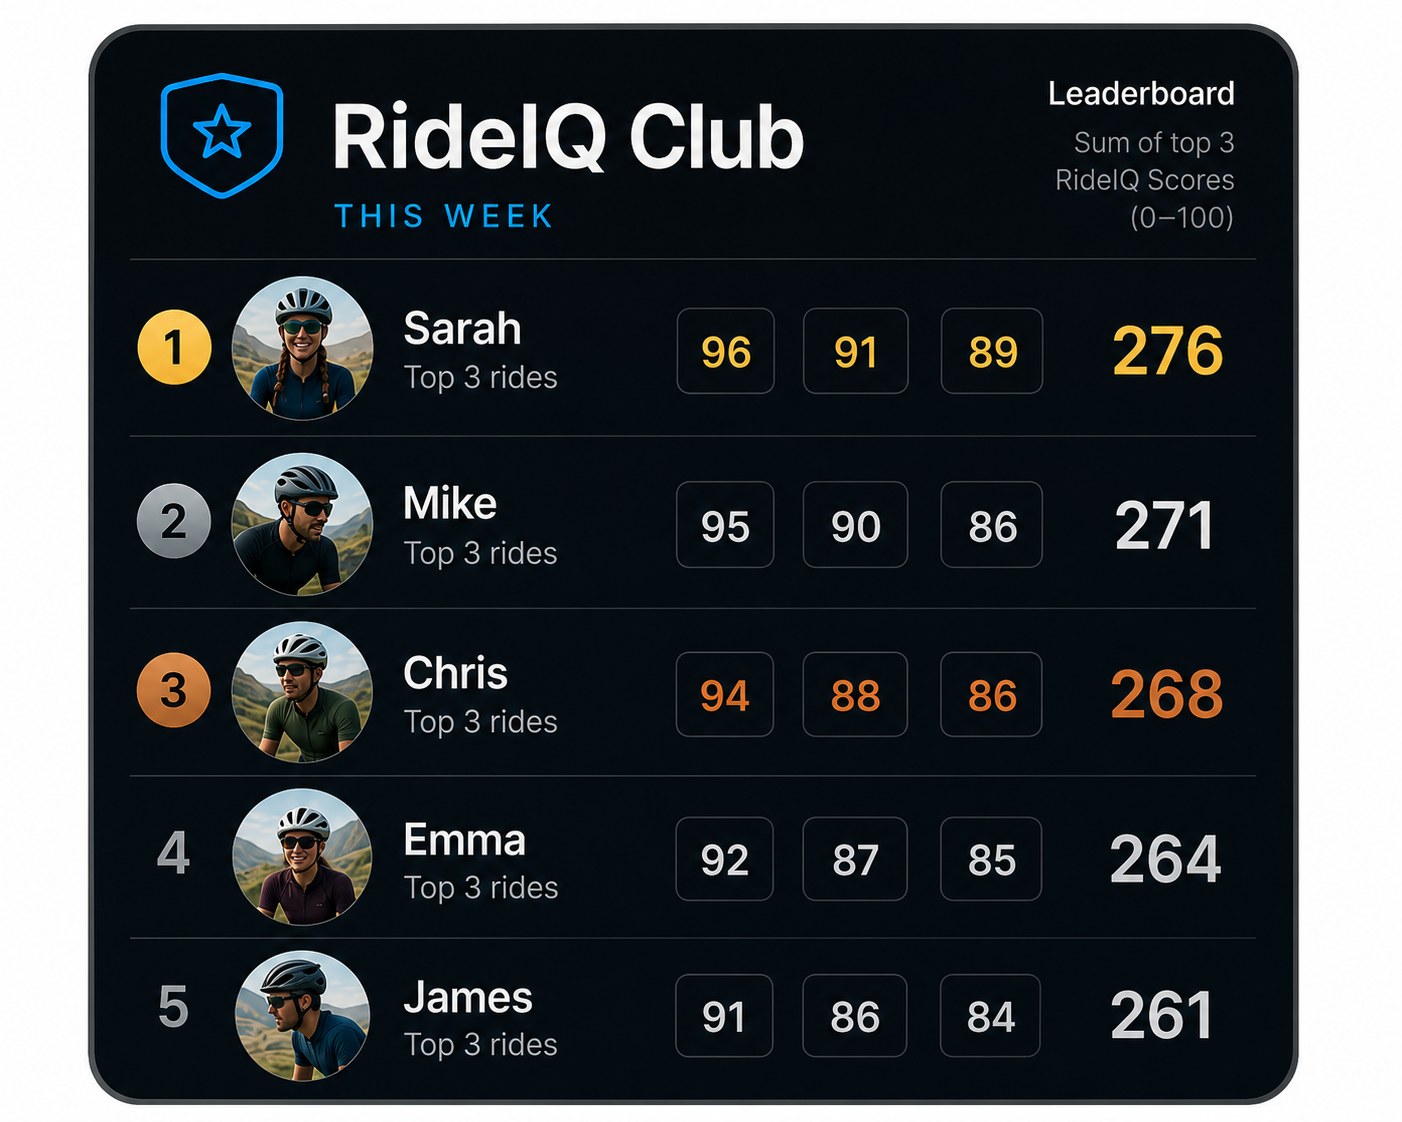
A leaderboard you can actually win.
Create a club or join one. Each week your three best RideIQ Scores go on the board, and it resets every Monday. Because scores are relative to your own history, a first-season rider can finish above someone with twice the power.
Real-road testing for reviewers
We are not asking you to review RideIQ — we are offering it as an instrument for the testing you already do. Wheels, tires, pressure, position, clothing, or whether a training block actually changed anything: ride the control, swap the part, ride the same loop again, and RideIQ Lab reports the difference in watts from your own riding. One morning and one loop is enough, though you will need a power meter — the comparison is measured in watts. Tell us what you are testing and where it will appear, and we will set you up with extended access.
Start with the riding you have already done
Connect Strava and RideIQ brings in up to two years of your rides, then scores the next one against the rider you actually are. Free for 30 days, no obligation — then US$6.99 a month or US$59.99 a year.
Questions about the trial, power meters or your data? See the FAQ.