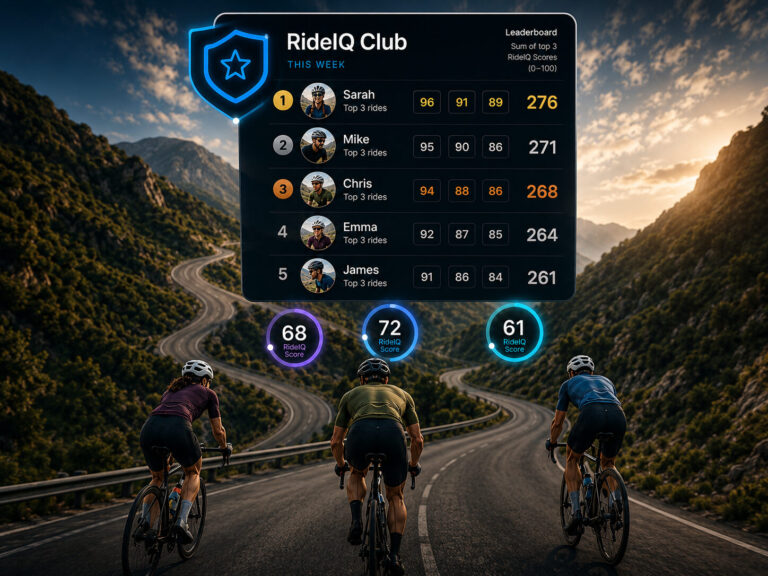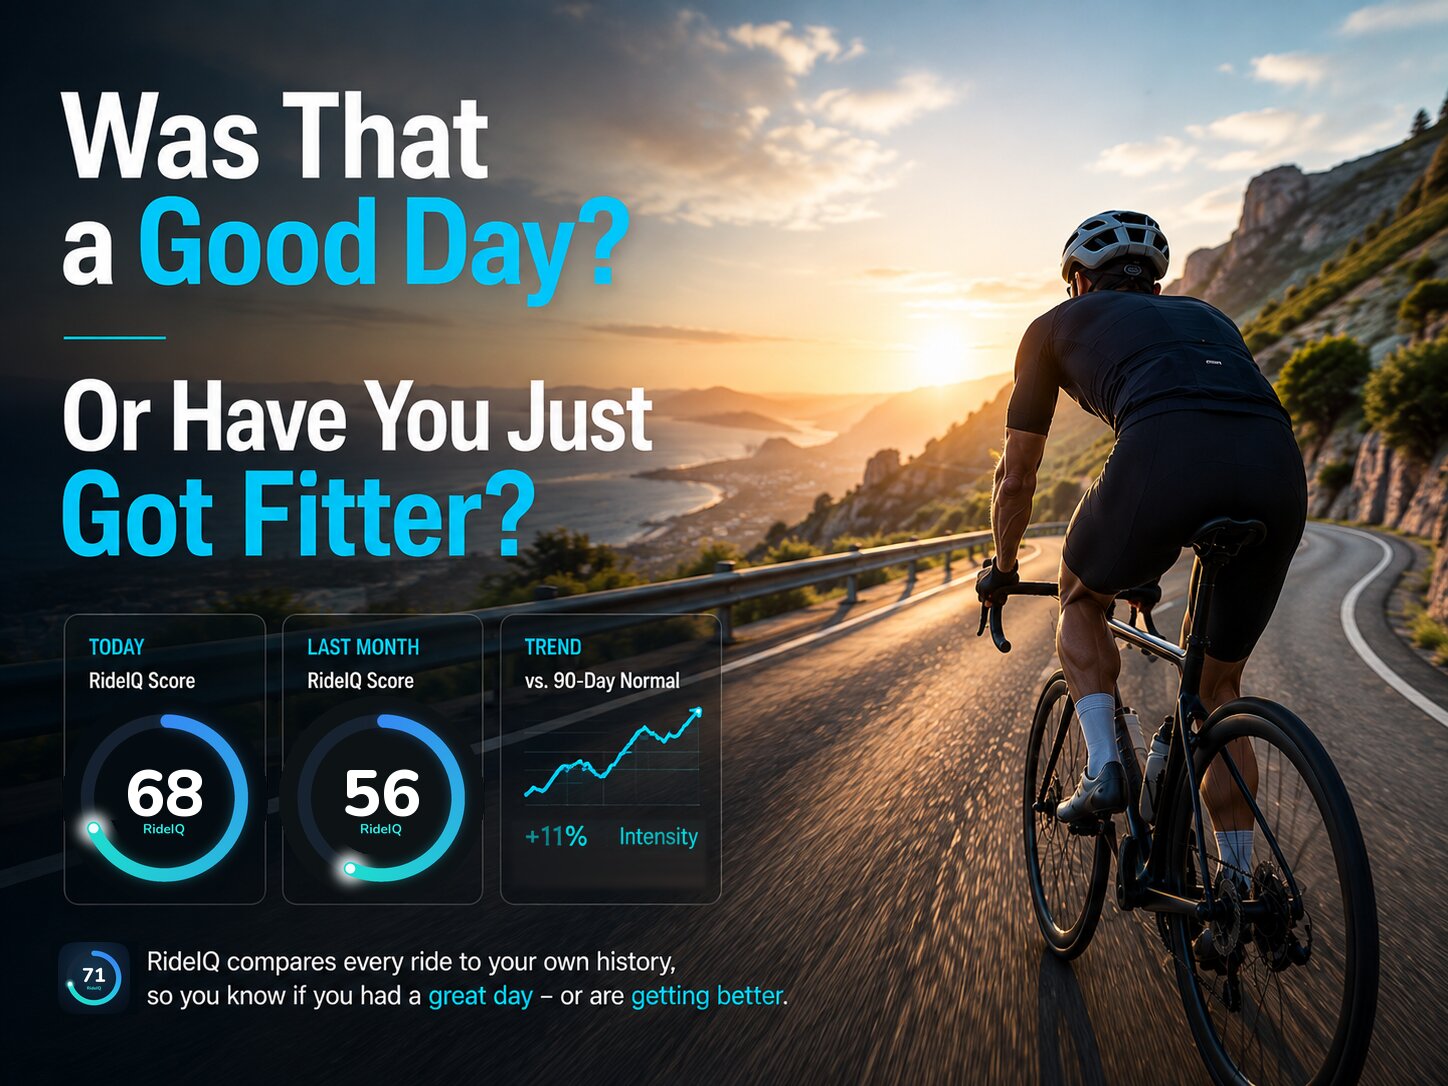
You finish a ride and RideIQ gives you a score. That is the headline: how today compared with your normal, in one number.
Sooner or later you want the rest of it. Why was it hard? Did I fade, or did I choose to ease off? Is this actually better than the last time I rode here, or does it only feel that way?
Two tabs answer that. One looks at a single ride in detail. The other holds it up against something else. It is worth knowing which question you are asking, because they are not the same question.
Advanced: one ride, under a microscope
The Advanced tab takes a single ride apart. Power, heart rate, speed, cadence and elevation, read together, and set against your recent riding wherever there is enough of it to compare.
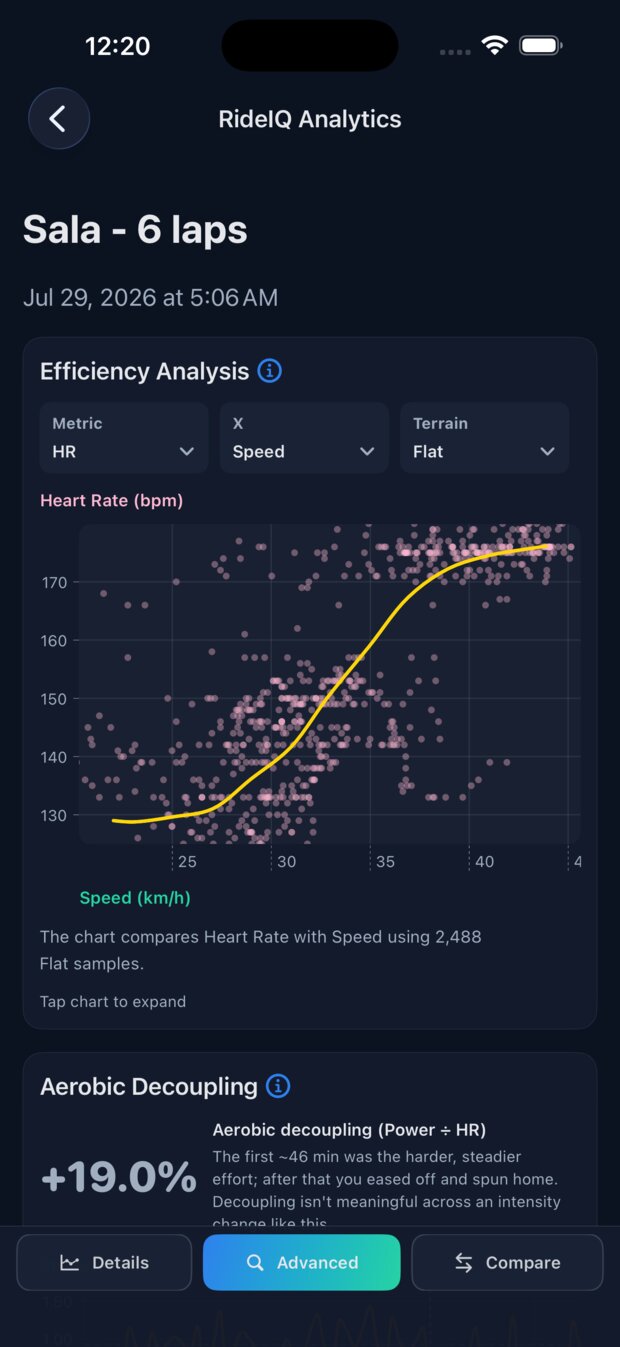
The efficiency chart plots effort against result. On flat ground that is power or heart rate against speed — how much you spent, and how fast it made you go. Coasting, soft-pedalling and junk samples are filtered out first, and your usual curve is drawn underneath, so you can see this ride against your normal rather than in isolation.
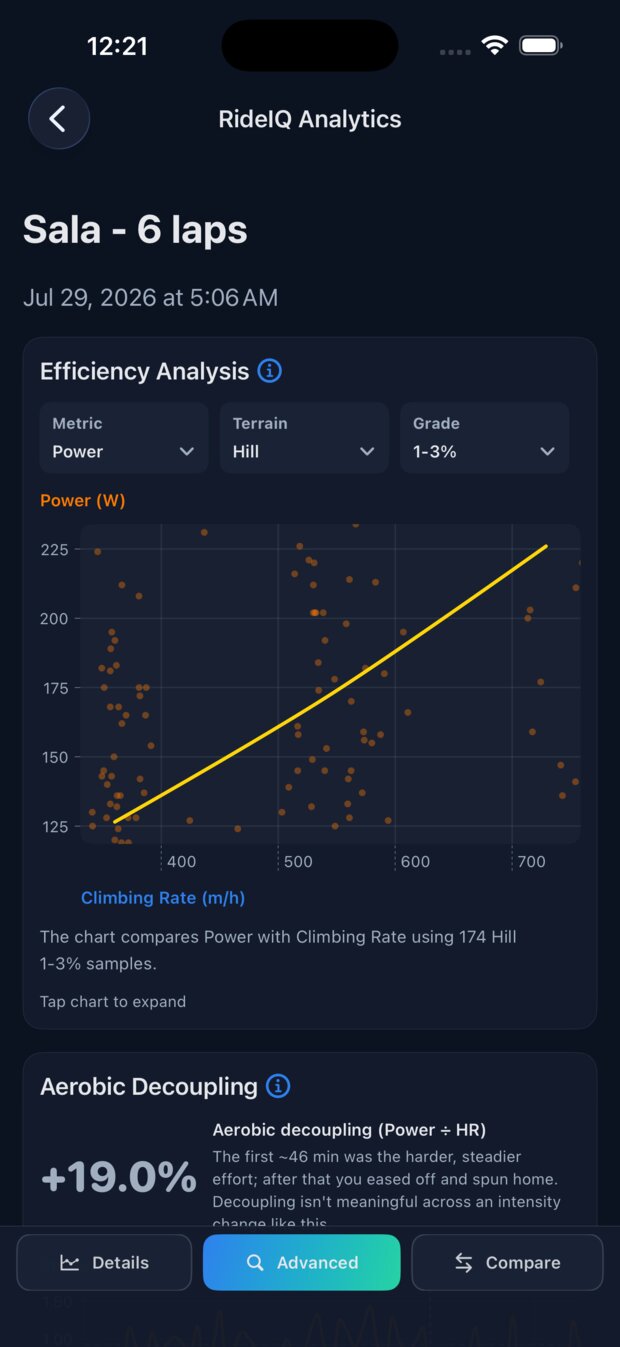
On climbs it changes the question. Road speed on a hill tells you about the hill, not about you, so the chart switches its horizontal axis to climbing rate — vertical metres gained per hour — with grade bands you can select. A climb is judged on how fast you gained height. That is the honest measure, and it is the one that lets a steep day and a shallow one be compared at all.
Decoupling, and knowing when not to read it
Aerobic decoupling measures whether you held together. As a ride goes on, heart rate tends to creep up for the same output — you are working harder to do the same thing. Measure that drift and you have a read on durability.
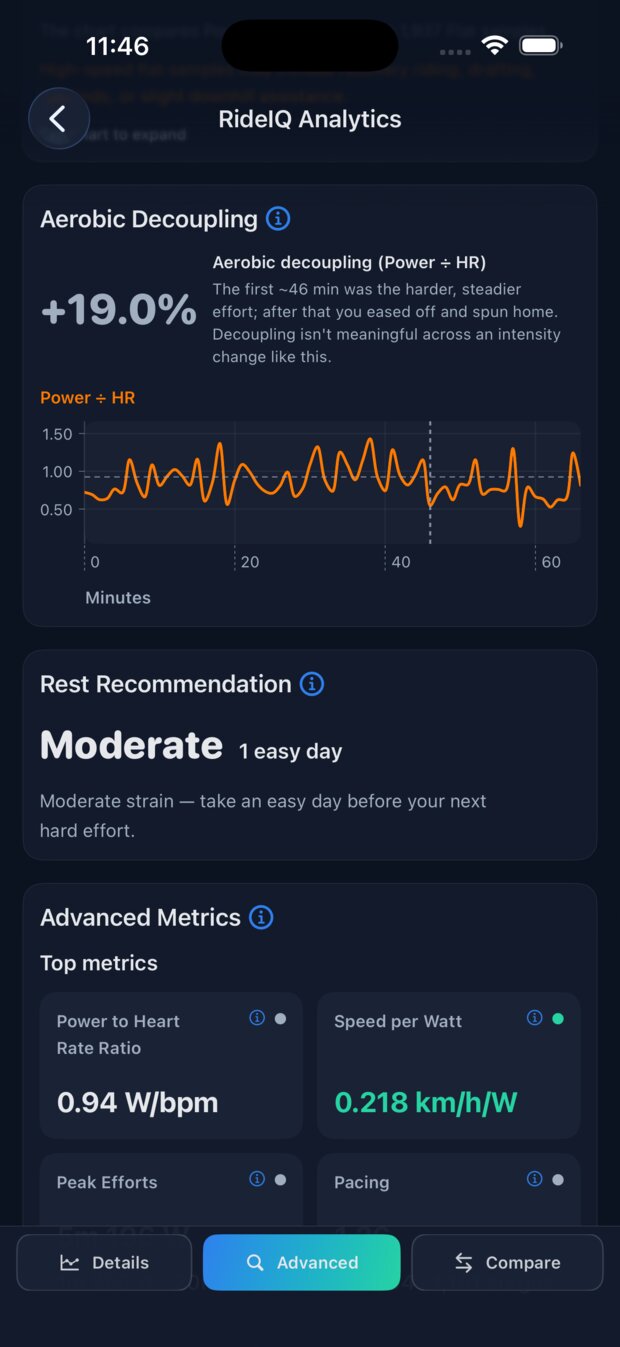
Most tools calculate it by splitting a ride down the middle and comparing halves. That works for a steady ride and falls apart on a real one. Ride hard to a café and spin home, and the second half is easier because you decided it would be — not because you fell apart.
RideIQ looks for where the effort actually changed rather than where the clock did. On the criterium ride, it found the number and then declined to stand behind it: the first forty-six minutes was the harder, steadier effort; after that you eased off and spun home. Decoupling is not meaningful across an intensity change like this.
The figure was 19 per cent. A tool that wanted to look clever would have reported it and moved on.
What it took out of you
Alongside it sits a rest recommendation, worked out from the ride’s intensity and what you have been doing lately. Moderate strain, one easy day, that sort of thing.
Read it as information rather than instruction. It is a note on how much that ride cost you, offered after the fact. Nothing is scheduled, nothing is waiting, and ignoring it breaks nothing.
Below that, the metric tiles: power per heartbeat, speed per watt, climbing rate, peak efforts, pacing, cadence. The order is deliberate. Efficiency at matched effort and climbing quality come first, peak output next, and style measures like pacing and cadence last — because how much you produced matters more than how tidily you produced it.
Compare: the same ride, against something
A single ride only tells you so much. The Compare tab puts it next to something else, and it does that two ways.
Against another ride
Pick a previous ride — RideIQ suggests a comparable one — and both efficiency curves are drawn on the same axes. Power against speed by default, heart rate or climbing rate if you prefer, flat sections or climbs.
Here are two laps of the same circuit, eight days apart.
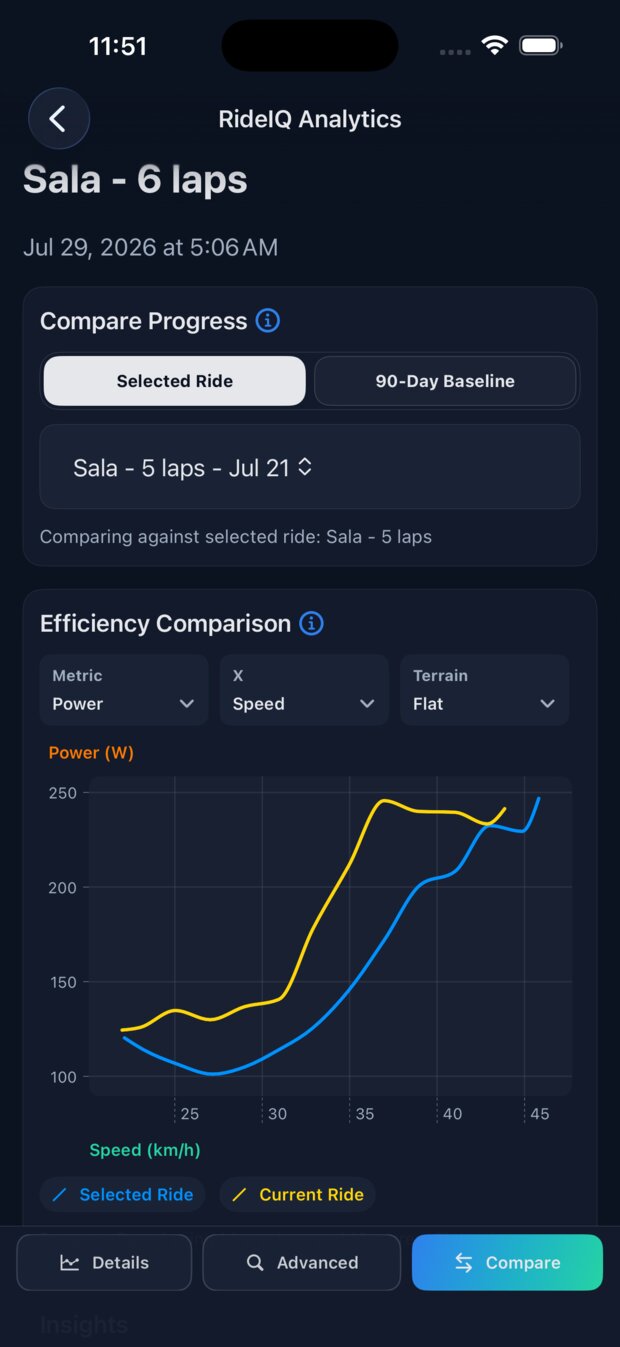
The later ride sits above the earlier one across the whole range. At thirty-five kilometres an hour it is taking something like sixty watts more to hold the same speed. That is not a subtle decline in form. That is a mechanical problem.
It was. I had not pumped my tires up before going out.
Strictly, tire pressure is the Lab’s job rather than this one. But a gap that size does not stay hidden in the tab it belongs to, and there is something reassuring about a comparison that shows you a problem it was not looking for.
Underneath the chart, the head-to-head numbers — power per heartbeat, speed per watt, climbing rate, normalised power, heart rate, cadence, intensity, volume and the two RideIQ Scores, each showing both figures so you can see what actually moved. Then a written verdict — and this is where it earns its keep, because it reads the context before it credits anybody. A ride in a group with a wheel to sit behind is not compared with a solo effort as though they were the same thing. Wind gets taken into account. If you tagged new equipment, that possibility is weighed before your fitness is praised or blamed.
Against yourself
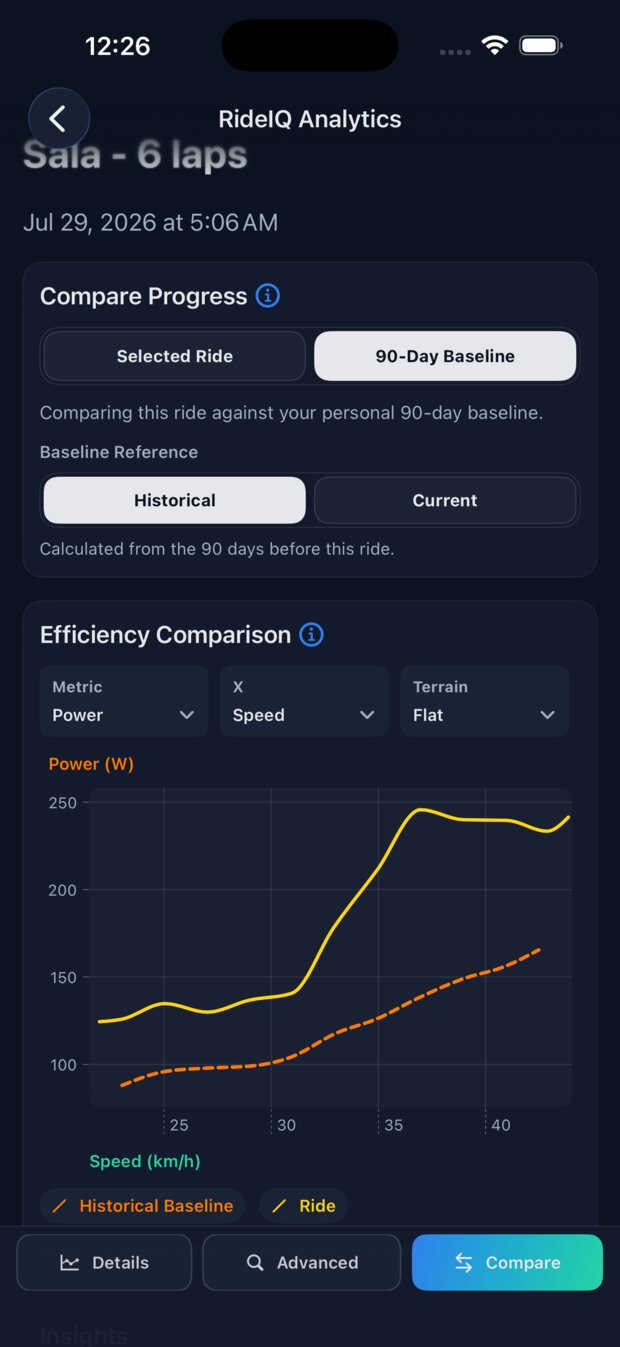
The second mode drops the other ride entirely and compares against your ninety-day baseline — the same picture of your riding that the RideIQ Score is built from.
And then it asks which version of you.
Historical uses your baseline as it stood on the day of the ride. Current uses your baseline now.
That sounds like a small toggle. It separates two questions that get confused constantly. Was that a good ride? is a question about the day — you against the rider you were that morning. Have I improved? is a question about the months since — that same ride against the rider you are now.
A ride that felt outstanding in March may sit squarely in the middle of what you now do every week. That is not the ride getting worse. That is the point.
Efficiency and progress are different questions
The baseline view splits in two, and that split is the most useful thing in the tab.
Efficiency asks how many watts it took to hold a given speed. Lower is better. Progress asks how many watts you produced at a given heart rate. Higher is better. They sound like the same question. They are not.
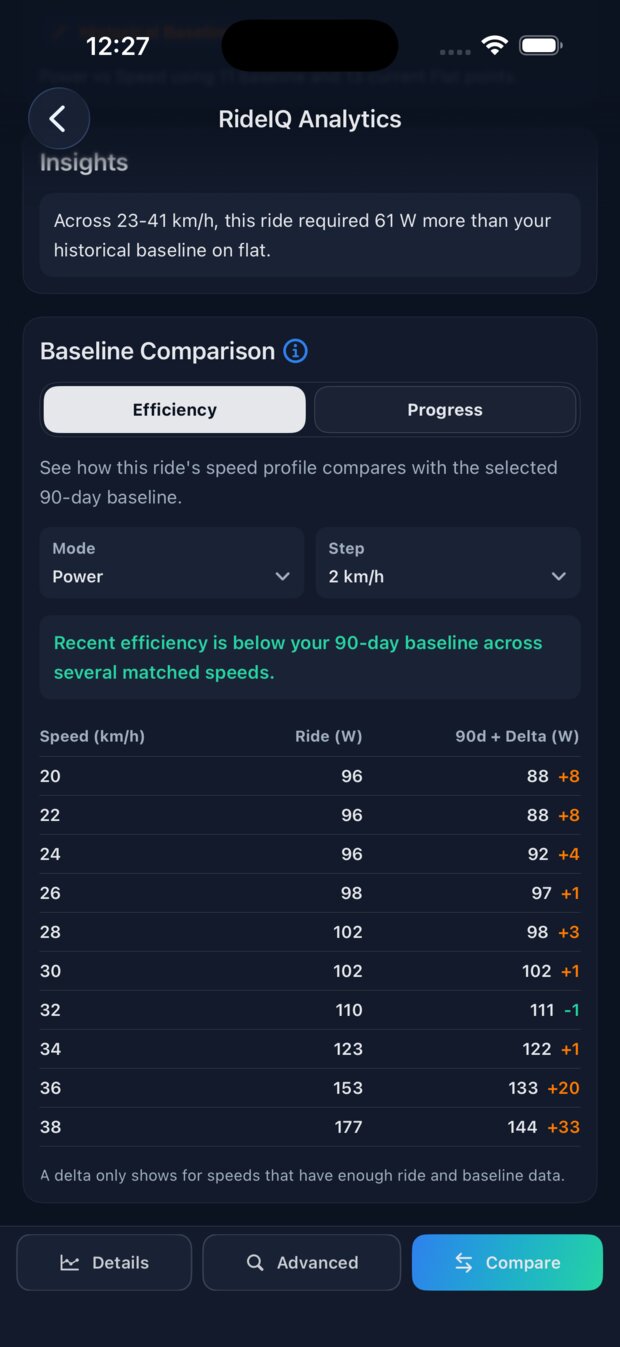
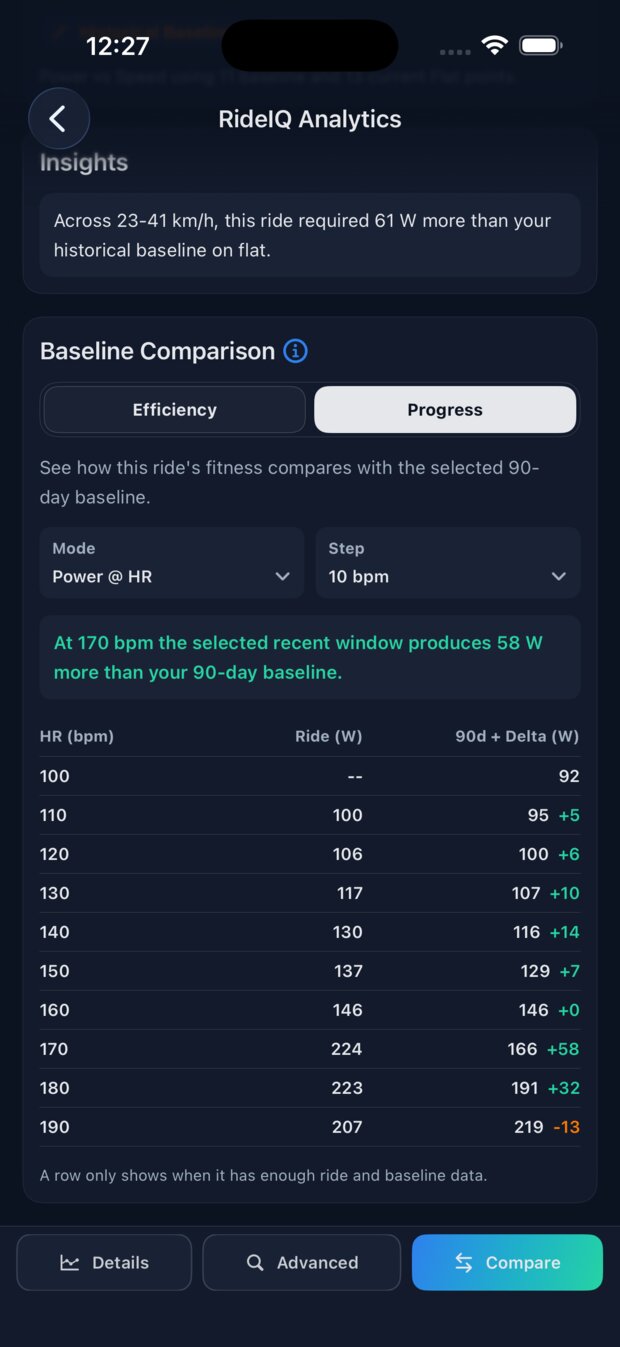
On the criterium ride the two came back saying apparently opposite things. Efficiency: across 23 to 41 km/h, this ride required 61 W more than your historical baseline on flat. Progress: at 170 bpm the selected recent window produces 58 W more than your 90-day baseline.
Both are true, and a third view settles it. Progress can also be read the other way round — how hard your heart worked for a given power — and on that measure the ride came back consistent with your 90-day physiological baseline. The engine was doing exactly what it normally does.
So: nothing wrong with the rider. The power was there, it cost what it usually costs, and it was simply buying less speed than it should have — because the tires were soft.
A single verdict would have had to choose one and been half wrong. Kept apart, they say something precise: good rider, slow bike. Which is exactly the line between what this tab measures and what the Lab does.
How this differs from RideIQ Lab
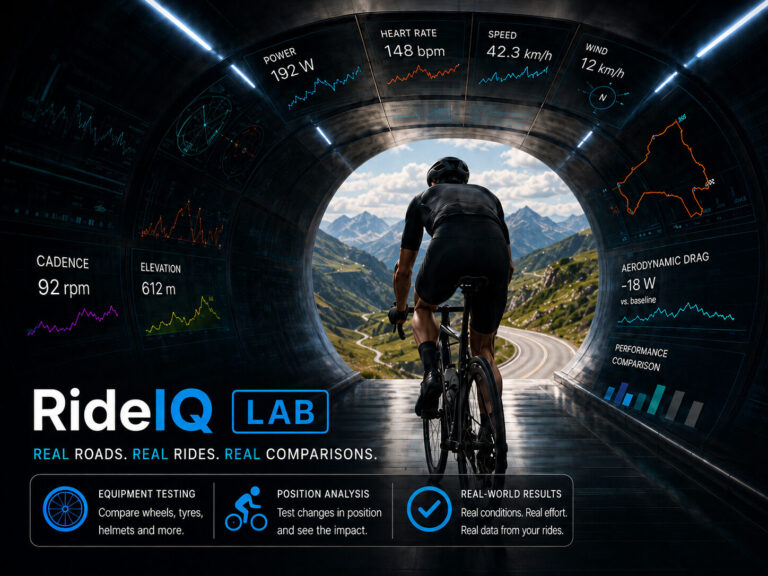
Both draw power-at-speed curves for two rides, so it is worth being clear about which one you want.
Lab measures the equipment. To do that it has to hold everything else still: solo efforts, similar conditions, one thing changed. Group rides and weather are contamination, because the rider is the variable being cancelled out.
Compare measures the rider. It wants a similar route, but it tolerates the mess — group rides, drafting, wind — and accounts for them in the verdict rather than demanding you eliminate them. The equipment is the thing being cancelled out.
Same maths, opposite question. If you want to know whether the wheels were worth it, that is the Lab. If you want to know whether you are getting faster, it is this.
None of it happens while you ride
Worth repeating, because depth like this usually arrives with something strapped to your handlebars telling you about it. None of this is live. There is no alert, no target, nothing to obey.
You ride however you feel like riding, and the analysis is waiting when you get home. We made the fuller case for that in Ride your ride. RideIQ writes it up.
Was that a good day, or have you just got fitter?
Most riding questions are one of those two, and most apps answer them with the same number.
The score tells you what happened. Advanced tells you how your body produced it. Compare tells you whether it is better than before — and lets you choose whether “before” means the rider you were that day, or the one reading this now.
Ride first. Ask afterwards. The answers keep.
See what your last ride actually says about you.
Free for 30 days, no obligation. Subscribe whenever you like — the rides you have already brought in stay yours either way.
New to RideIQ? See everything the app does →